On December 12 this year, there were parliamentary elections in the United Kingdom for the third time in five years. The country is in the middle of an unprecedented and deep division brought about by the 2016 Brexit referendum, and after more than a year of gridlock the latest election finally provided a path forward after Boris Johnson’s Conservatives won a solid majority and can begin pushing through their Brexit plan in the New Year.
For those who don’t know, elections in the United Kingdom are similar to those in Australia, in that the country is divided into six hundred and fifty constituencies, each of which elects a single member to the parliament, and the party with the majority of seats in the parliament forms the government (or, if there is no majority, negotiates with minor parties to form a coalition government in the hung parliament).
There is a big difference however in how individual members win their constituencies. The United Kingdom uses a simple first-past-the-post (or FPTP) system, where the candidate with the most votes wins the seat. This means that it is entirely possible, and indeed common, that a candidate without a majority of voters from his constituency behind him wins (this happened in 172 seats (26.4%) in 2017 and 228 seats (35.1%) in 2019).
In Australia, this problem is solved elegantly with our preferential voting system, where voters are required to list their preference for every candidate standing in their seat, in order. Votes are then counted in “instant runoffs”: the candidate with the fewest first-preference votes is eliminated, and their votes are transferred to the remaining candidates according to the second preference of those exhausted ballots. This process continues until only two candidates remain; the winner is the candidate with the majority (called his “two-candidate preferred” vote). This ensures that the winning candidate was “more preferred” than the losing candidate by a majority of voters. There is a slightly weaker version of this system, called “optional preferential voting” or OPV, which is used in New South Wales state elections, where voters may choose to only vote for a single candidate, or preference some but not all, or preference all candidates. This is a happy medium between first-past-the-post and full preferential, in which some ballots are exhausted without being counted, but voters have the full ability to preference all candidates if they desire.
In May 2011, the United Kingdom held a referendum on changing its voting system from FPTP to OPV, which was known in the UK as AV, for “alternative vote”. The Conservatives, in power at the time in a coalition with the centre-left Liberal Democrats, had agreed to hold the vote as part of their coalition negotiations. Most established political interests were against the idea, and the referendum result was a heavy defeat for the pro-AV campaign, which lost 68-32.
I thought it might be an interesting exercise to simulate what might have been the results if the 2019 election had indeed been held under the AV system. I went a little further (and removed one degree of freedom from the model, since we don’t need to also estimate the proportions of voters for each party who don’t want to preference anyone) and simulated the election under full preferential voting, as in Australian federal elections.
In order to simulate the “instant runoff elections” in the preferential system, one needs to make assumptions about how people would have voted preferentially, because the only actual data we have is of their first preference (there is an additional complexity here, that people would change their first preference if the voting system was different, in order to vote tactically. I’m ignoring this complexity as well).
In Australian elections, it is common to measure the proportions of votes of minor parties which “eventually flow” to one of the two major parties. For example, votes for Green party candidates have the Labour alternative preference ahead of the Liberal preference on around 85% of ballots. This means to conduct a simulated runoff of a three-way race between a Liberal (say the candidate received 45% of the first preference vote in a poll), a Labour (30%) and a Green (25%), we would assume the Green candidate’s votes are distributed 85/15 between the Labour and Liberal candidates. This means the Labour candidate wins the two-party-preferred 30 + 0.85 * 25 = 51.25% to 45 + 0.15 * 25 = 48.75%.
I was interested to see, based on the high amount of votes for third parties in the election, the high number of seats won by a plurality and not a majority of votes, and the conversation surrounding tactical voting before the vote, whether there was some combination of preference flows which would have given a result different than a Conservative majority.
England and Wales
In England and Wales, the two major parties (the Conservatives and Labour) dominate, with significant votes for the Liberal Democrats, and in this election also for the nationalist Brexit Party. There are also small votes for the Greens, and in Wales for the Welsh nationalist Plaid Cymrú.
I ran the runoff simulations for all 573 seats in England and Wales, for different imaginary scenarios of preference flows from the two biggest minor parties. The most important parameters are the percentage of Liberal Democrats preferences which flow to the Labour party, and the percentage of Brexit Party preferences which flow to the Labour party. I assume for simplicity’s sake that if \(x\)% of preferences flow to Labour, then \((100-x)\)% flow to the Conservatives. The other minor parties distribute their preferences evenly among all relevant candidates.
If I simulate a range of values of these percentages, we obtain a grid of different outcomes for the different imaginary scenarios, summarised in the table below.
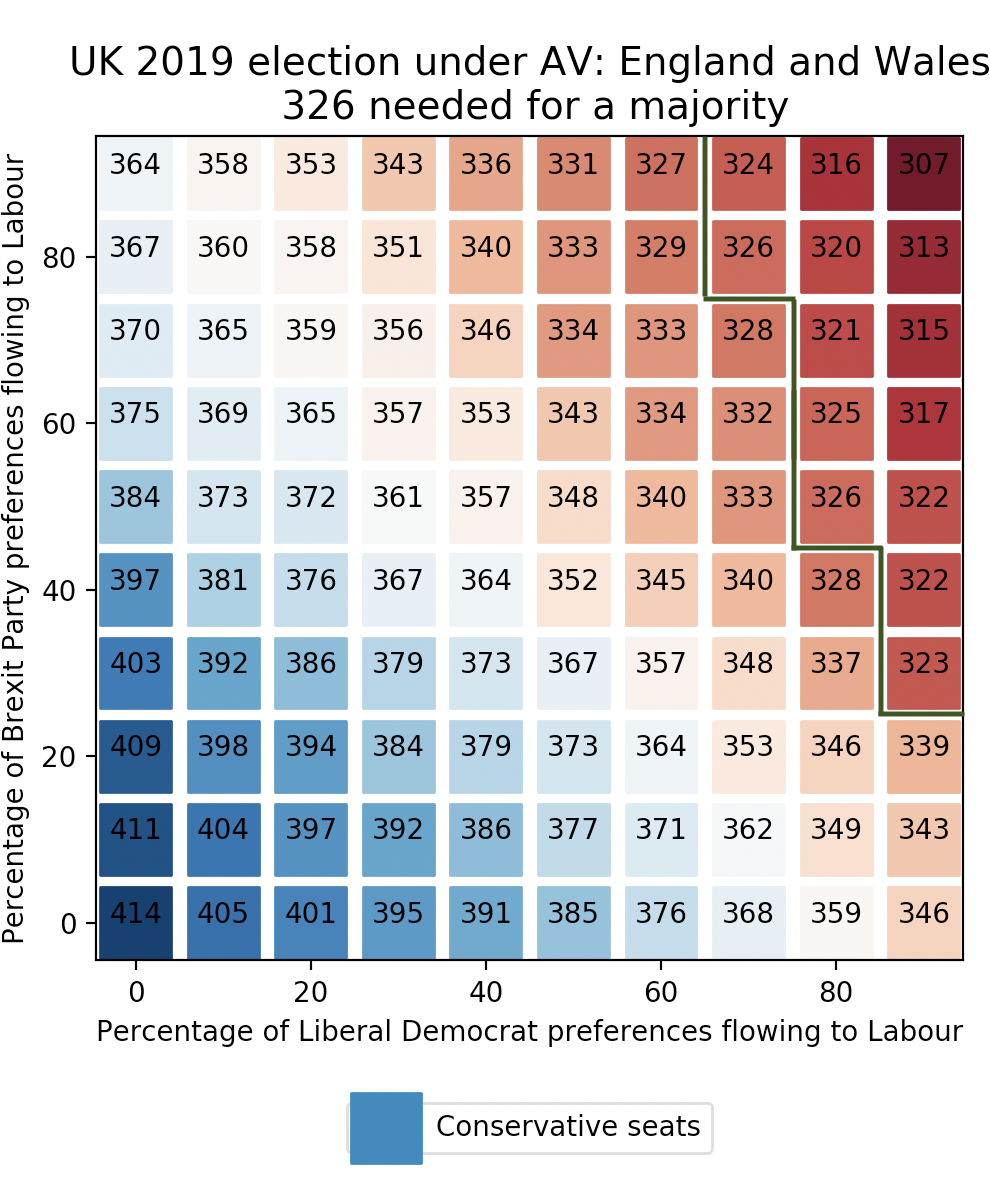
In the actual election, the Conservatives won 359 seats (62.7%) in England and Wales, and by adjusting the different preference flows we see the result could have been anywhere between 307 (53.6%) and 414 (72.3%) seats.
The Conservatives actually won enough seats in England and Wales to put them over the threshold of the 326 required to form majority government. So any scenario in which the result is different will require a substantially different result here. The green line in the chart above divides the scenarios into those in which the Conservatives win enough seats in England and Wales to win a majority government, no matter what the result in Northern Ireland and Scotland, and those where its wins do not suffice, in which their gains in the remainder of the country may or may not allow them to form a majority government. Notice that any such scenario requires a high percentage of both Liberal Democrat preferences and Brexit Party preferences to flow to Labour.
I suspect that very few Brexit Party voters would have stomached the thought of Jeremy Corbyn as Prime Minister, but on the other hand the swing away from Labour and the swing towards them points towards the existence of a swathe of lifetime Labour voters who wanted to get Brexit over with but could not stand voting Tory.
Scotland
The political situation in Scotland is quite different to England and Wales. Since the 2014 Scottish Independence referendum, the country’s Westminster politics have been dominated by the pro-independence Scottish National Party, or SNP, who favour an independent Scotland as as full member of the European Union.
To run the simulations in Scotland, I tweaked two parameters: the percentage of Liberal Democrat preferences flowing to the SNP, and the percentage of Labour preferences flowing to the SNP, showing Labour’s status as a third party in Scotland since the post-referendum realignment. Below I plot for each combination of these parameters, the projected number of Conservative seats in Scotland, which ranges from 1 to 24 (they won 6).
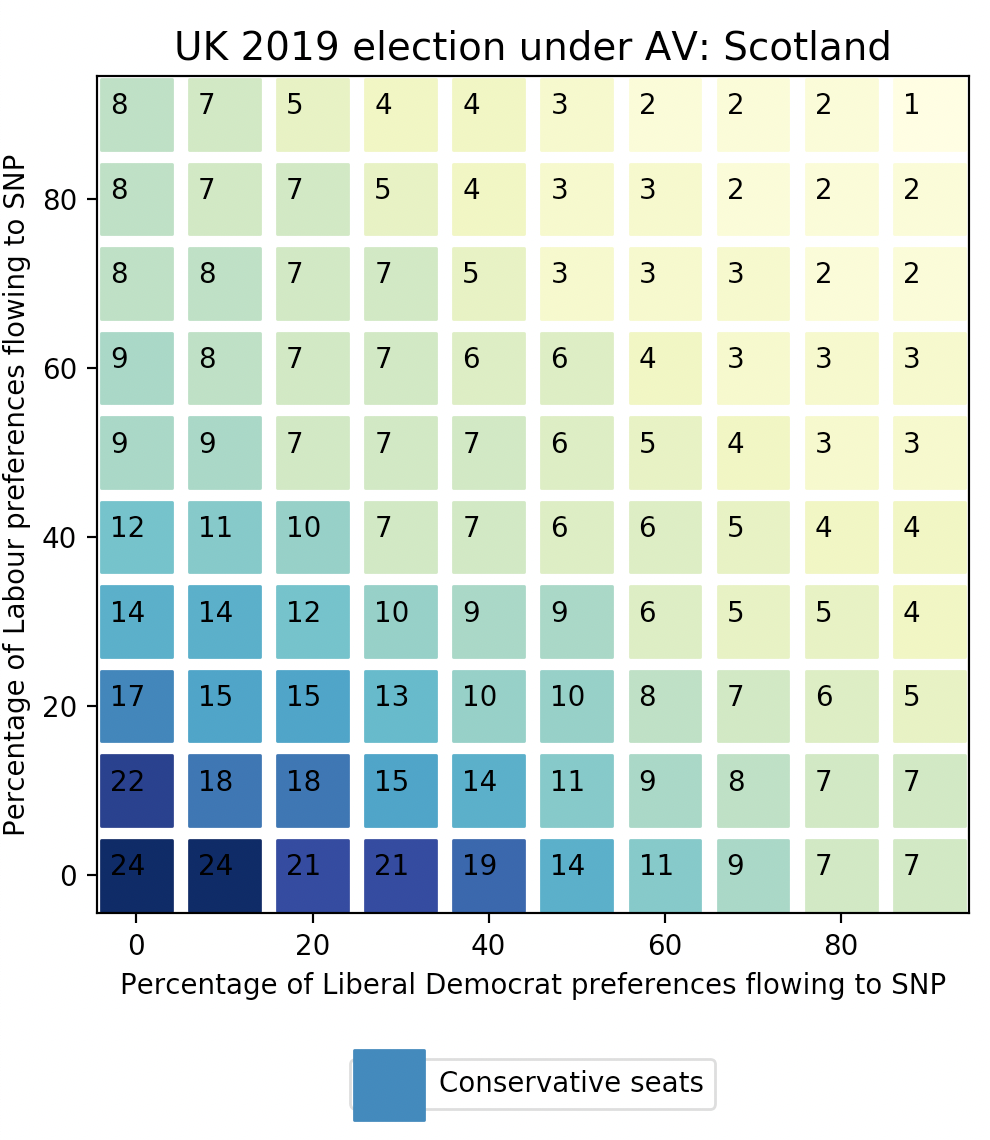
The SNP and the Conservatives’ visions for the future of the United Kingdom do not align and it would be hard to see them working together in a coalition government. So a very low performance here and in England and Wales could still deny the Conservatives an outright majority without looking to Northern Ireland and the DUP.
Nothern Ireland
Northern Irish Westminster politics is different again, and I have to say I am the least familiar with it. But I do know that the split is mainly along Republican/Unionist lines, is geographically striking, and that the Democratic Unionist Party (DUP) was just in a Coalition government with the Tories. So their seats can be assumed to go towards a Conservative majority (the Conservatives and Labour themselves do not have a significant presence in Northern Ireland). The Labour Party’s equivalent (though with a significant point of difference on their stance towards a united Ireland) is the Social Democratic and Labour Party (SDLP).
Here, I run scenarios with combinations of two parameters: the percentage of Irish nationalist Sinn Fein’s preferences which flow to the SDLP, and the percentage of the centrist liberal Alliance Party of Northern Ireland (APNI). Below I plot the projected number of seats won by the DUP, which ranges from 7 to 9 (they won 8).
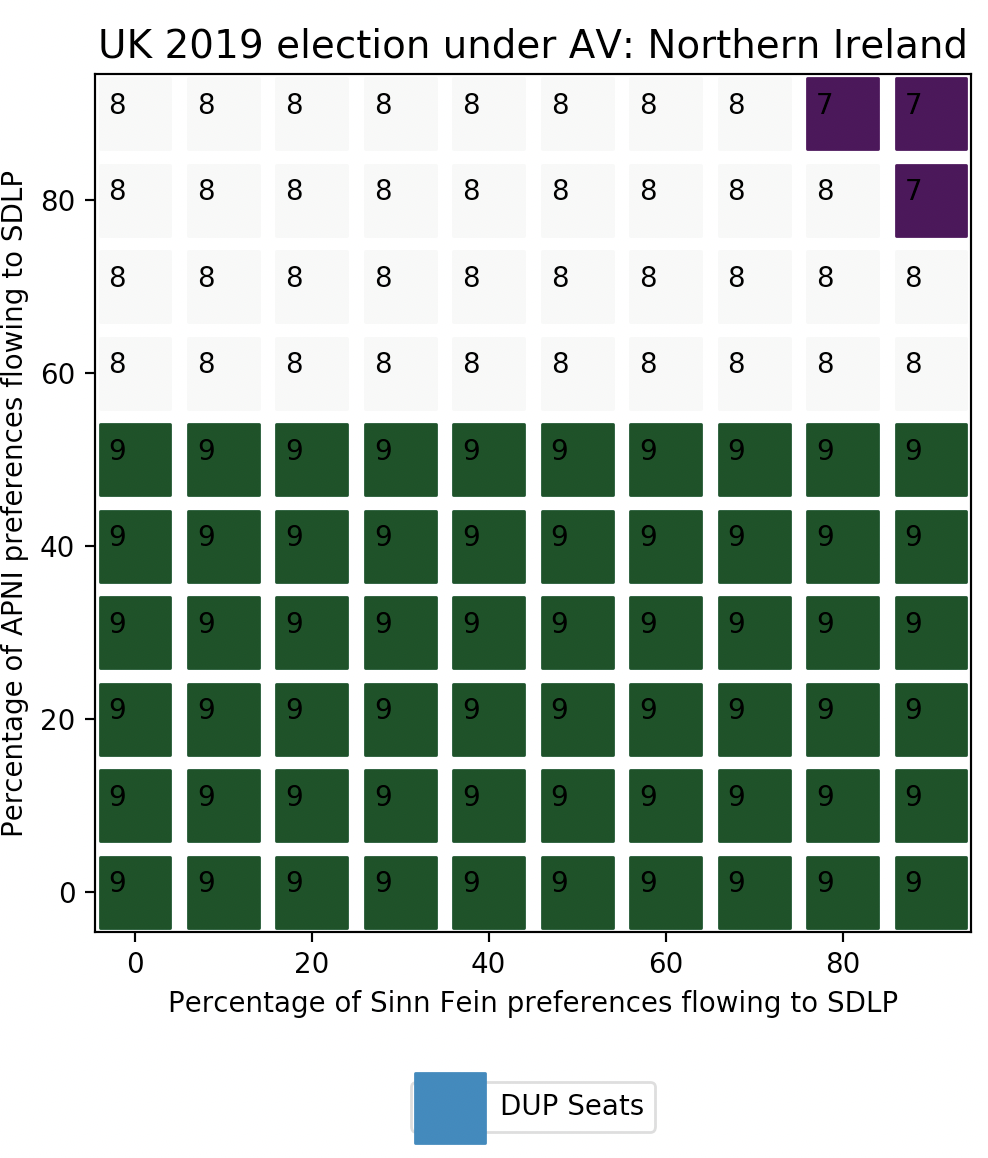
So in the worst case in which over 90% of both Sinn Fein and APNI voters preference the SDLP over the DUP, the Tories can count on only 7 seats here, and will need 319 from the remainder of the country to form their Coalition government, or 326 to govern outright. A very strong SNP performance in Scotland (helped by tactical preferential voting from Labour and Liberal Democrat voters) will mean that some of the England and Wales scenarios inside the green boundary in the first image are still in play: certainly if the aim is only to deny an outright majority government.
I’ve put the source code for this small experiment on Github, and would love to hear comments and feedback via email or Twitter.