The below graph of the ALP and Coalition two-party preferred vote from the 2013 election until the eve of the 2016 election contains a massive amount of information and gives many insights about Australian politics and the electoral cycle.
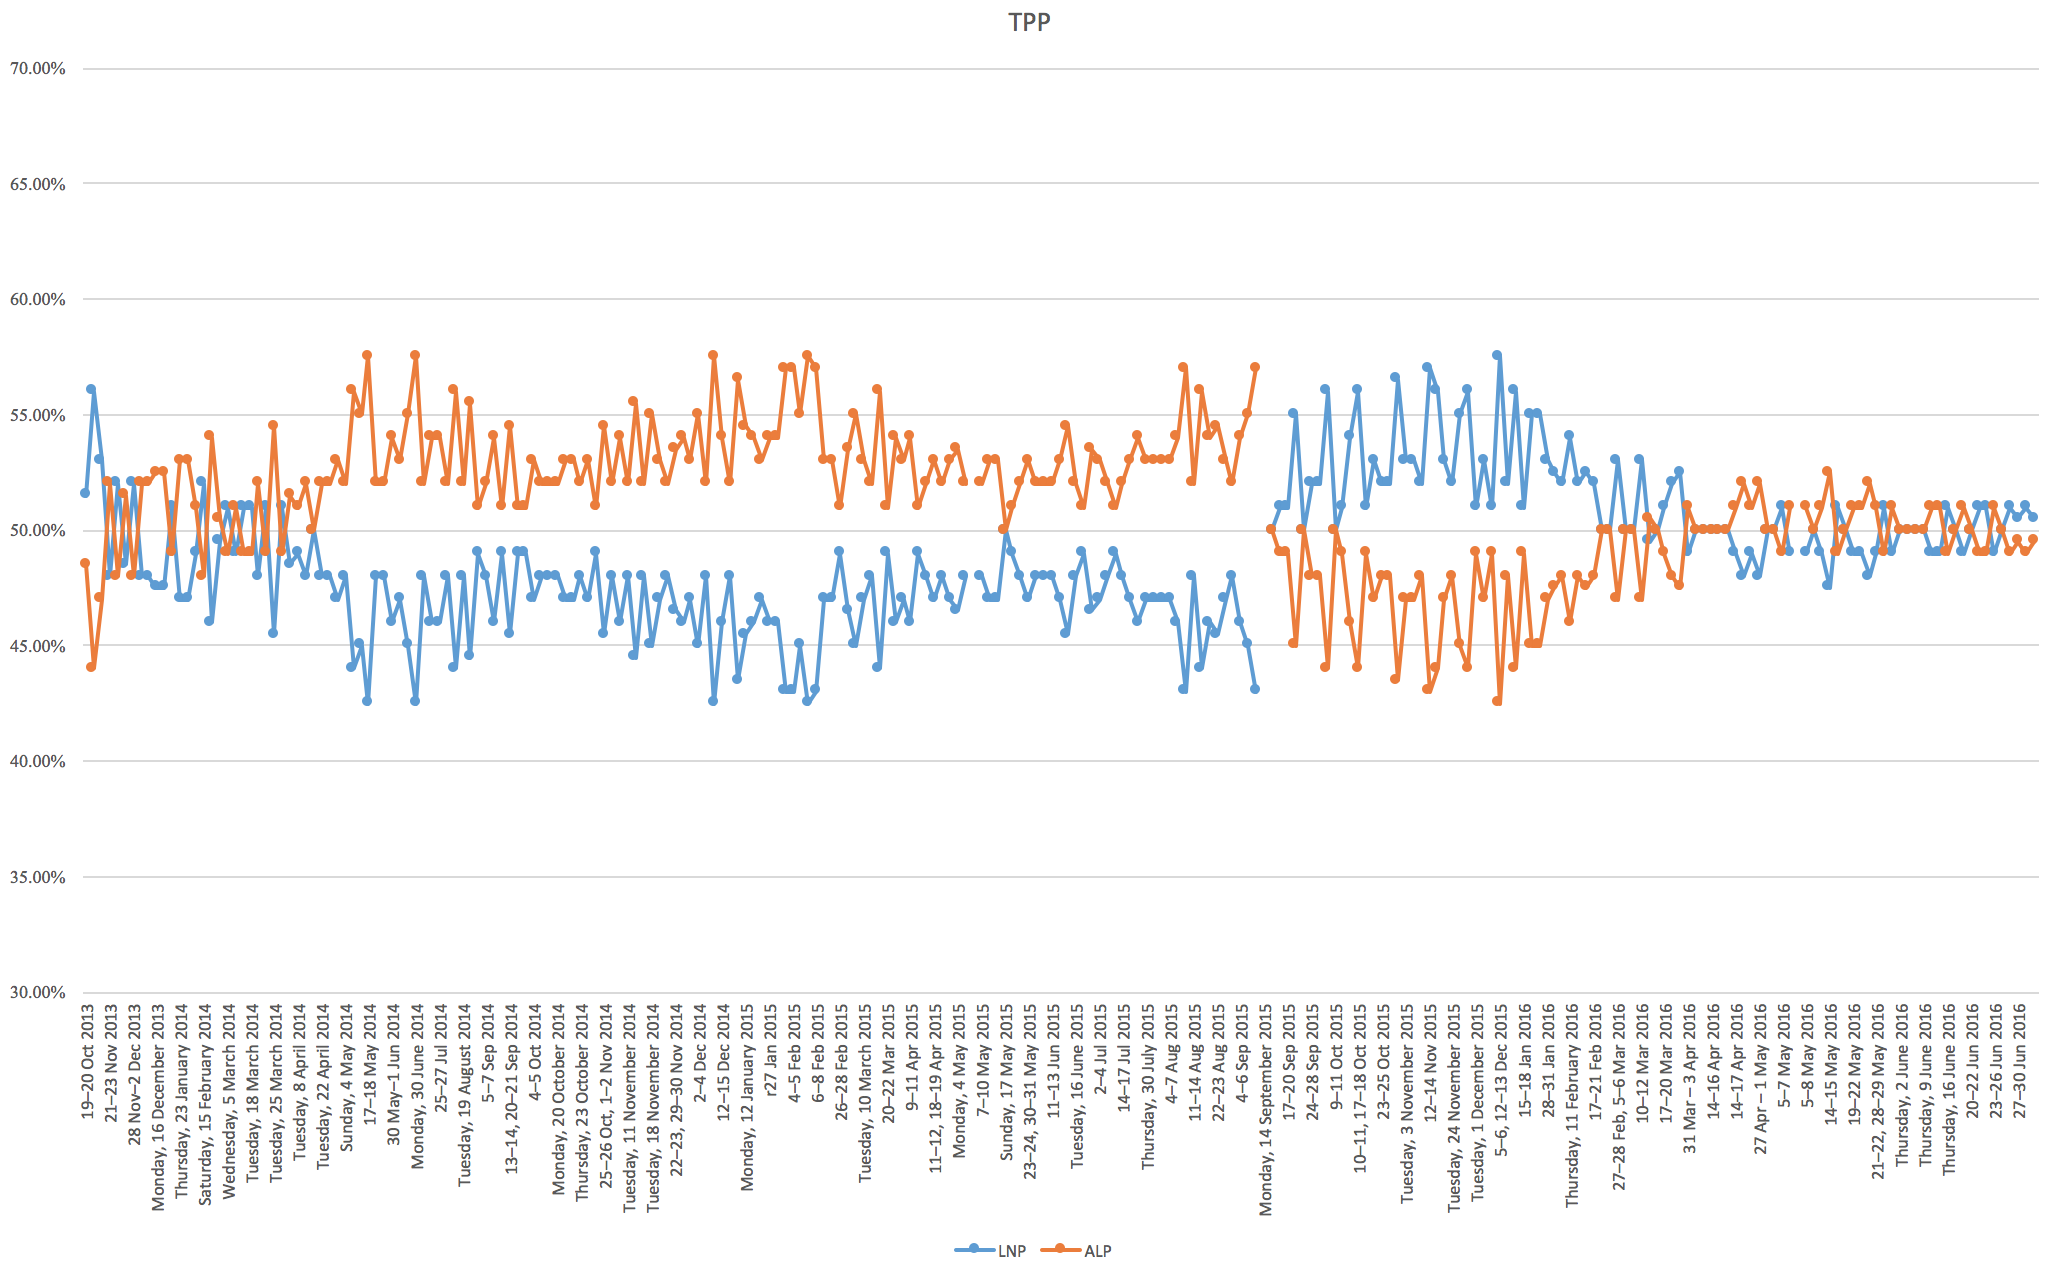
I want to make a few comments about some features on this graph and then talk about the opinion polls in general and how they related to the actual result in a series of posts.
Honeymoon period
The “honeymoon period” of a new leader is a phrase that gets a lot of airtime in Australian politics, and this cycle provided an opportunity to witness the full honeymoon between Prime Minister Malcolm Turnbull and the Australian people, which began in September 2015 when he replaced Tony Abbott as leader of the parliamentary Liberal party, and ended in around April when opinion polls began to show the two parties’ TPP support in a statistical tie, where it remained until election day.
The interesting question is whether this is a feature of Australian politics in general, or whether this particularly dramatic course was peculiar to Turnbull.
This century, there have been eleven changes of leadership in the two major parties. For each change in leadership, I looked the average of the five polls taken immediately before and immediately after the change and obtained the following list. The Gov? column indicates whether the parter was in government (3 times) or not (8 times), and the How column indicates the way the old leader was removed: either deposed (6 times), resigned (3 times), or retired (2 times).
| Year | Month | Party | Old Leader | New Leader | Gov? | How | Before | After | Change |
|---|---|---|---|---|---|---|---|---|---|
| 2001 | November | ALP | Kim Beazley | Simon Crean | No | Resigned | 49.5 | 48.3 | -1.2 |
| 2003 | December | ALP | Simon Crean | Mark Latham | No | Resigned | 50.1 | 50.5 | 0.4 |
| 2005 | January | ALP | Mark Latham | Kim Beazley | No | Resigned | 46.7 | 47.4 | 0.7 |
| 2006 | December | ALP | Kim Beazley | Kevin Rudd | No | Deposed | 53.2 | 57.1 | 3.9 |
| 2007 | November | COA | John Howard | Brendan Nelson | No | Retired | 45.7 | 40.5 | -5.2 |
| 2008 | September | COA | Brendan Nelson | Malcolm Turnbull | No | Deposed | 42.8 | 44.6 | 1.8 |
| 2009 | December | COA | Malcolm Turnbull | Tony Abbott | No | Deposed | 43.4 | 44.2 | 0.8 |
| 2010 | June | ALP | Kevin Rudd | Julia Gillard | Yes | Deposed | 50.7 | 53.5 | 2.8 |
| 2013 | June | ALP | Julia Gillard | Kevin Rudd | Yes | Deposed | 46.3 | 50.6 | 4.3 |
| 2013 | October | ALP | Kevin Rudd | Bill Shorten | No | Retired | 48.6 | 47 | -1.6 |
| 2015 | September | COA | Tony Abbott | Malcolm Turnbull | Yes | Deposed | 45.8 | 51.4 | 5.6 |
The data clearly supports the common notion of a “honeymoon effect”, but only when the old leader is deposed (an average immediate lift in the polls of 3.2 percentage points). There are two deeper and more interesting questions here:
- how long do these “honeymoon periods” last for?
- is it worth changing leaders for the uptick in the polls?
In order to answer these questions we need to make some definitions. For the six changes of leadership resulting from deposals (3 ALP, 3 Coalition), let’s define the “honeymoon period” to be the time between the change of leadership, and the first time the five-poll average dips below the average when the change of leadership took place. If this doesn’t happen before the next leadership change, we’ll define this as “infinite”.
| Deposal Date | New Leader | Honeymoon Period (1st def.) |
|---|---|---|
| 04/12/2006 | Rudd | 1230 |
| 16/09/2008 | Turnbull | 60 |
| 01/12/2009 | Abbott | 1860 |
| 24/06/2010 | Gillard | 31 |
| 26/06/2013 | Rudd | Infinite |
| 14/09/2015 | Turnbull | 410+ |
This table agrees with the media narrative from the tumultuous past decade of Australian politics:
- Kevin Rudd was a highly effective Labor leader and the push to replace him with Gillard was a political mistake
- The shift to Malcolm Turnbull as opposition leader in 2008 was a disaster
- Tony Abbott was a highly effective opposition leader who struggled as Prime Minister
Notice we are unable to say anything yet about Malcolm Turnbull’s stint as PM, nor was Rudd Prime Minister long enough for the second time in 2013 to say much from the data.
There is another possible definition: the honeymoon is defined as over the first time the new leader is in a “losing position” (i.e. the five-poll average shows him or her getting below 50.0% in the TPP). We define the honeymoon period as 0 if the deposal was not enough to bring polling above zero. Using this definition we arrive at a slightly different table:
| Deposal Date | New Leader | Honeymoon Period (2nd def.) |
|---|---|---|
| 04/12/2006 | Rudd | Infinite |
| 16/09/2008 | Turnbull | 0 |
| 01/12/2009 | Abbott | 0 |
| 24/06/2010 | Gillard | 36 |
| 26/06/2013 | Rudd | 11 |
| 14/09/2015 | Turnbull | 300 |
The best approach is probably a combination. Define the honeymoon period to be
- if the leadership change bumps polling to above 50%, until the next time the party is in a losing position
- if not, until the next time the party dips below the level of support when the deposal happened
Using this we can come up with an “effectiveness score” for each leadership deposal. You can think of this score as calculating the “area” under the polling curve inside the honeymoon bump and normalising.
| Deposal Date | New Leader | Score |
|---|---|---|
| 01/12/2009 | Abbott | 3.2 |
| 04/12/2006 | Rudd | 2.1 |
| 14/09/2015 | Turnbull | 0.5 |
| 16/09/2008 | Turnbull | 0.1 |
| 24/06/2010 | Gillard | 0.1 |
| 26/06/2013 | Rudd | 0.0 |
Interestingly, using the polling data only we arrive at the usual media narrative.