
Australia has a very unique electoral system, with geographic “districts” (almost universally referred to as electorates) modelled on the British Westminster system but with two significant differences: preferential voting (you have to provide your preference order for all candidates in your electorate), and compulsory voting (you’re fined if you don’t vote).
After spending a bit too much time on Australian political Twitter I thought it might be an interesting intellectual exercise to re-imagine Australian elections over the last fifty years in an alternative universe where they took place under a different system.
Before we start I will give the massive caveat that the political history of a country is inseparable from its electoral system - the types of parties and issues that evolve out of the current system in Australia would not necessarily emerge under a different system. So it’s more of a thought experiment than any kind of suggestion about which system is better or worse, though the downsides of both systems are easily apparent in the comparative analysis.
The current system versus proportional representation
The system I chose to compare with is proportional representation. PR, in its purest “party list” sense, means that a legislative body is comprised of parties whose share of the body equals their share of support in the electorate. Usually there are some compromises in countries that implement proportional representation in a single at-large electorate (Israel, which I am most familiar with, Scandinavian countries, South Africa, Japan, and many more), the most common being an “electoral threshold” that prevents a parliament from having to deal with an unmanageable mob of single members from niche parties1. Countries with true proportional systems generally have governments comprised of coalitions of several parties, and a key post-election phase is the negotiation of the new coalition.
A geographically divided system, where the country is split into many electorates, is less likely to produce such governments since small parties must come first at least somewhere in the country, rather than maintain a small but broad level of support nationwide, to win representation. Australia’s preferential voting system, and its degeneration over the years into “how-to-vote cards”, has further entrenched the two major parties, the Liberal/National Coalition (not a coalition in the PR sense since these parties have agreements to avoid three-cornered contests) and the Australian Labor Party. The result is that although the Australian electoral system has more in common with the British system, its federal lower house looks a lot closer to the United States House of Representatives.
 |
|---|
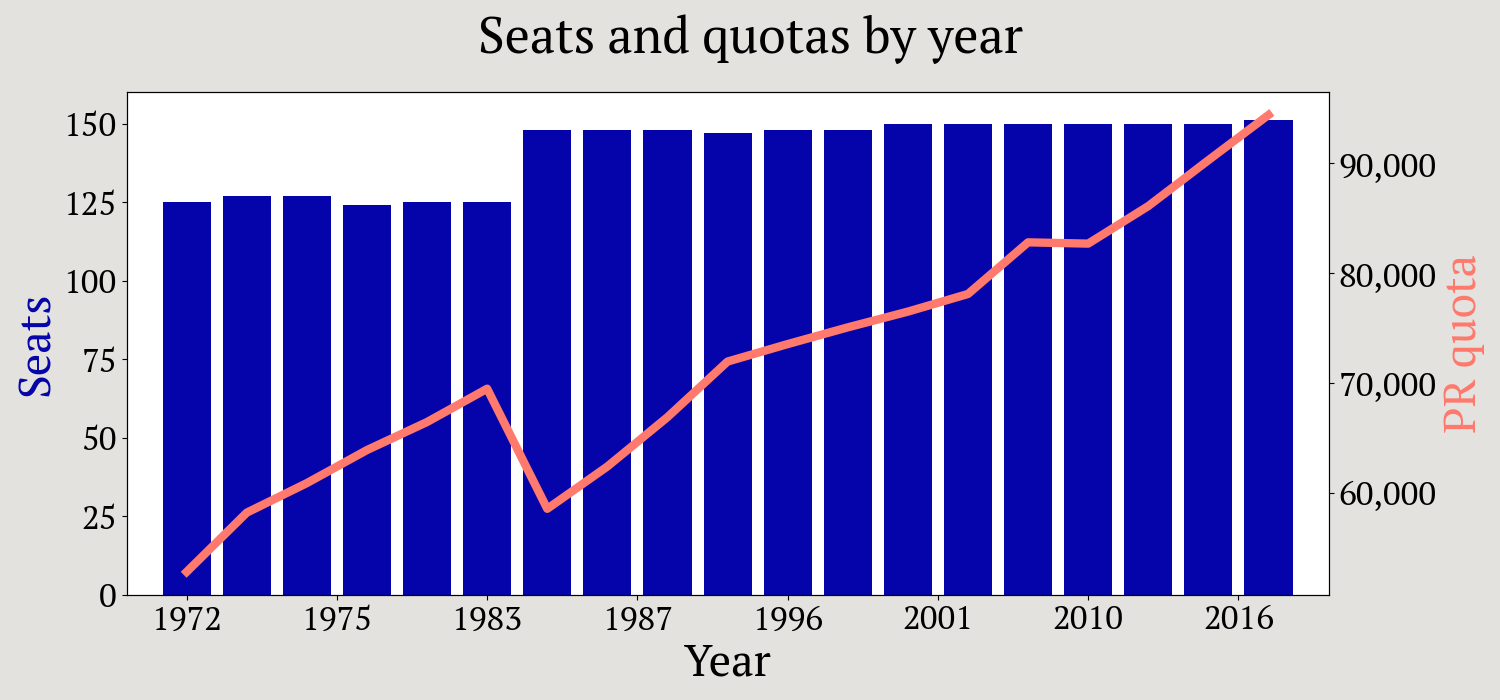
| Figure 1: Seats and quotas by year. |
So what would Australian political history look like if we’d had a party list PR system? Let’s set the ground rules for our alternative universe. A party list system with a single vote per person (so no preferences) and no threshold: even if you get enough votes to receive a single seat, you’re in. I’m going to look at nineteen elections in the last fifty years, from 1972 to 2019. In Figure 1 you can see how the number of seats in parliament has changed (on the left $y$-axis), and the corresponding total number of votes required nationwide to win a single seat (on the right $y$-axis); this is called the quota (it’s mostly increasing because of population growth and sometimes decreasing because seats were added to the parliament).
A final note before getting into the results for each election: the Australian Senate is elected with proportional representation, but with six large electorates, one for each state. So I’ve included below for each year the real Senate result. The difference between the House result under PR and the senate is due to the outsized influence of smaller states like Tasmania and South Australia, who get the same amount of senators (12) as the significantly more populous Eastern states. Of course there are additional complications that prevent us from reading too much into this: first, the Senate does use preferential voting like the House, and also only half of all Senators are up for election in a given election (unless it’s a double dissolution, like in 1974, 1975, 1983, 1987 and 2016).
Results by year
1972
Reality: Labor victory (67-58), PM Whitlam.
Under PR: Narrow left-wing bloc majority (65-60), PM Whitlam.
Senate: Coalition + DLP majority.
Before the Dismissal in 1975, the political news of the day was the schism in the Labor party and the breakaway of the Democratic Labor Party, which happened in 1955, led by a right-wing Catholic bloc within the party. By 1972 the DLP held the balance of power in the Senate and usually sided with William McMahon’s Liberal/Country coalition.
The House of Representatives though went 67-58 in the 1972 election, with zero seats going to third parties. The DLP received 5.25% of first preference votes nationwide; they receive 7 seats in our alternative universe. It’s not enough to unseat the narrow left-wing coalition of Gough Whitlam’s re-energised Labor party, and the Australia party, a predecessor to the Australian Democrats of the 80s and 90s. Their 3 seats together with Labor’s 62 are enough to give Whitlam a majority in the 125-seat parliament, ending 23 years of Liberal government, just like reality.
1974
Reality: Labor victory (66-61), PM Whitlam.
Under PR: Narrow left-wing bloc majority (67-60), PM Whitlam.
Senate: Tied.
1974 was a weird one: a double dissolution election held simultaneously with four technical referendums that all failed (and all four were carried in New South Wales). It took place only eighteen months after the 1972 election, so was seen as a vote of confidence in the Whitlam government’s reform agenda. The Liberals gained a net three sets and the Labor party lost one (two seats had been added since the previous election). It was also the first election where the franchise age was 18 instead of 21.
This election gives the closest result in our alternative universe to the real result of all the nineteen elections I analysed; the left-wing coalition of the Labor Party (63), the Australia party (3) and the Australian Democrats in their first election (1) has 67 seats to the right-wing coalition’s (Liberals, Country Party, DLP and an independent) 60.
1975
Reality: Landslide Coalition victory (91-36), PM Fraser.
Under PR: Coalition victory (67-54, 5 crossbench (2 DLP, 1 AUS, 1 IND, 1 DEM)). PM Fraser.
Senate: Coalition majority.
The 1975 election was a big one - Governor General John Kerr had just removed Prime Minister Gough Whitlam from office, and new Prime Minister Malcolm Fraser was seeking a mandate from the public. In reality, he received a substantial one: a landslide 91-36 victory, sending Labor to opposition until 1983.
In our alternative reality, the result is a little closer: where the seat-based, preferential system gives a landslide, the PR system recognises that the shift from Labor to Liberal, although dramatic, was deserving of a little less than a landslide. And indeed, nationwide the swing against Labor was -6.5%, bringing their total first preference votes down to 43%, and the swing to the Coalition was 7%, bringing theirs to 53%. The 67 seats they win under PR give them a very slim majority in the 127-seat parliament which is a big deal: this is the only election in the last fifty years that would have given a non-“small C” coalition government.
Another interesting fact about our PR universe: apart from the two-and-a-half year stint of the Fraser government, the Labor party were in government from 1972 to 1996.
1977
Reality: Landslide Coalition victory (86-38), PM Fraser.
Under PR: Narrow left-wing bloc majority (63-61), PM Whitlam.
Senate: Coalition majority.
Whitlam didn’t disappear after the Dismissal: he continued on as opposition leader until his defeat in the 1977 election, which Fraser won again in a landslide (his majority was reduced by five, but the parliament was also reduced by three seats from 127 to 124).
Under PR things get interesting - this is our first election where the government formed under PR is different than what happened in reality. Whitlam wins back the Prime Ministership, with the help of the recently formed Australian Democrats, whose 12 seats join with Whitlam’s 49 to give 61, the same as the Liberal / Country / DLP opposition. The two remaining members - taken by the Progress party and the Socialist party - would probably have been controversial in the anti-Communist furor of the late 70s, but a left-wing Coalition (maybe with Socialist abstentions) seems like the only real option.
 |
|---|
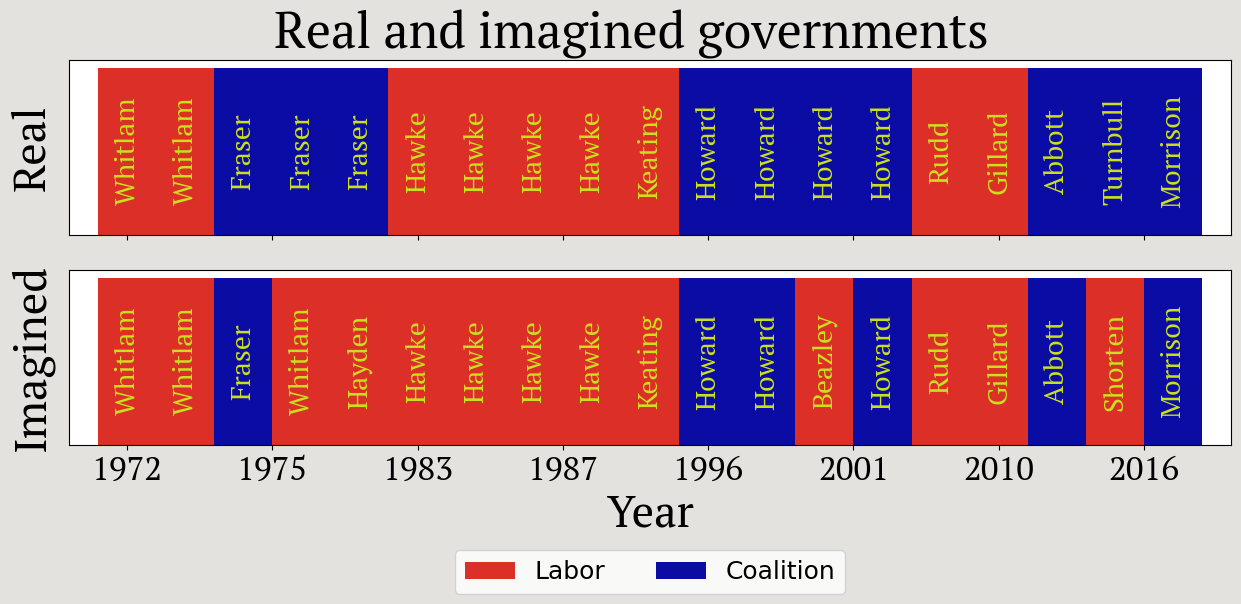
| Figure 2: Real and imagined governments by year. |
1980
Reality: Solid Coalition victory (74-51), PM Fraser.
Under PR: Narrow left-wing bloc majority (66-59), PM Hayden (or Whitlam).
Senate: Labor + Democrats majority.
Here’s another result that diverges from reality: in our PR world, Bill Hayden is elected Prime Minister2. We need to establish an alternative story for why Whitlam, who in reality retired soon after his 1977 defeat, is not contesting this election. By 1979 Whitlam had been leading the Labor party for 12 years, but he was still young at 53. So probably in a world where Whitlam won in 1977, you would think he would try again in 1980, so the more realistic outcome is a Whitlam comeback. Still, we’ll give it to Hayden for his place in the history books in our alternative universe.
In reality Fraser won convincingly again in 1980, although the Labor party did gain fourteen seats. In our PR universe the gain is more modest: three seats to 66 from their 1977 result of 63, but it does mean they are able to govern in coalition with only the Democrats and don’t rely on the Progress / Workers party (who I combined into single seat here).
1983
Reality: Solid Labor victory (75-50), PM Hawke.
Under PR: Solid left-wing bloc majority (70-54 + 1 IND), PM Hawke.
Senate: Labor + Democrats majority.
At the 1983 double dissolution election Labor won back government after three consecutive losses under the charismatic leadership of larrikin everyman Bob Hawke, his 75 seats to the Coalition’s 50 giving a very convincing majority in the House of Representatives.
In our alternative universe Hawke’s 62 seats are not quite enough to get him a majority, but with the Democrats’ six seats, the Worker’s Party’s one seat, and one mish-mash seat that I give to “Miscellaneous Left” (Communists, Progress, the first buds of an Australian Green movement and some others) there is a solid majority for the left-wing bloc.
1984
Reality: Solid Labor victory (82-66), PM Hawke.
Under PR: Narrow left-wing bloc majority (78-70), PM Hawke.
Senate: Labor + Democrats majority.
There was a dramatic increase in the number of seats in the House of Representatives ahead of the 1984 election, from 124 to 148. So both parties had a handsome number of new members and the Hawke government was re-elected with a comfortable (though reduced in percentage terms) majority. In our alternative universe this is a fairly uncontroversial victory for the now well-established Labor-Democrats coalition, who have been governing together since 1977.
1987
Reality: Solid Labor victory (86-62), PM Hawke.
Under PR: Narrow left-wing bloc majority (77-71), PM Hawke.
Senate: Labor + Democrats majority.
The federal opposition leader in 1987 was John Howard, who lost the election but would later make a comeback and go on to be Australia’s second-longest serving Prime Minister. Howard was defeated by popular incumbent Bob Hawke, who also wins in our alternative reality. A notable effect of PR that is visible here is swings far smaller between elections: changes are more subtle and margins are naturally thinner.
Indeed in this election, there is a net change of only one seat: Labor loses two, the Democrats gain one, the DLP loses one and a hodge-podge collection of minor right-wing parties (mostly votes from the Unite Australia Party and the Australian Family Movement, an ideological precursor to the far-right “family values” minor parties of the 2000s and 2010s, which originally formed as a single-issue group opposed to the raunchy musical Hair) gain one.
1990
Reality: Narrow Labor victory (78-69 + 1 IND), PM Hawke.
Under PR: Narrow left-wing bloc majority (78-70), PM Hawke.
Senate: Labor + Democrats majority.
1990 was the year of the Democrats - winning 11.26% of first preference votes from over one million Australians, they have 17 seats in our PR parliament, coming largely at the expense of the Labor party. The difference between the blocs remains essentially the same as last year, but within the left-wing bloc Hawke’s standing as Prime Minister would take a hit after the 6.5% swing against Labor.
The leader of the Australian Democrats, Janine Haines, who in reality stood down as leader after this election, finds herself in an enviable position after this election, much like Nick Clegg and his Liberal Democrats after the 2010 UK election (although a Labor-Democrats coalition is much more natural than the Conservative-Liberal Democrats one that transpired in 2010). Since Hawke has no lower house majority without Haines and her 17 seats, she becomes Deputy Prime Minister and several ministerial portfolios are given to senior Democrats.
1993
Reality: Solid Labor victory (80-65 + 2 INDs), PM Keating.
Under PR: Narrow left-wing bloc majority (77-70), PM Keating.
Senate: Labor + Democrats + Greens majority.
After years of damaging infighting and bitterness between Hawke and his Treasurer Paul Keating, Keating seized the Labor leadership in his second attempt in summer 1991, giving him fifteen months to settle in as Prime Minister before calling his first election, which he won unsurprisingly in the face of a devastatingly poor campaign by opposition leader John Hewson.
Having formed in 1992, this election marks the first appearance of the Australian Greens, long a force in Tasmanian state politics, at the federal level. They win two seats here, and with the Democrats’ six (the dramatic reduction in support is another nice analogue to the 2010 UK election) Keating has a small but comfortable majority for his left-wing bloc, and having won back eight seats for his own party, has to make fewer concessions to the Democrats than Hawke did.
 |
|---|
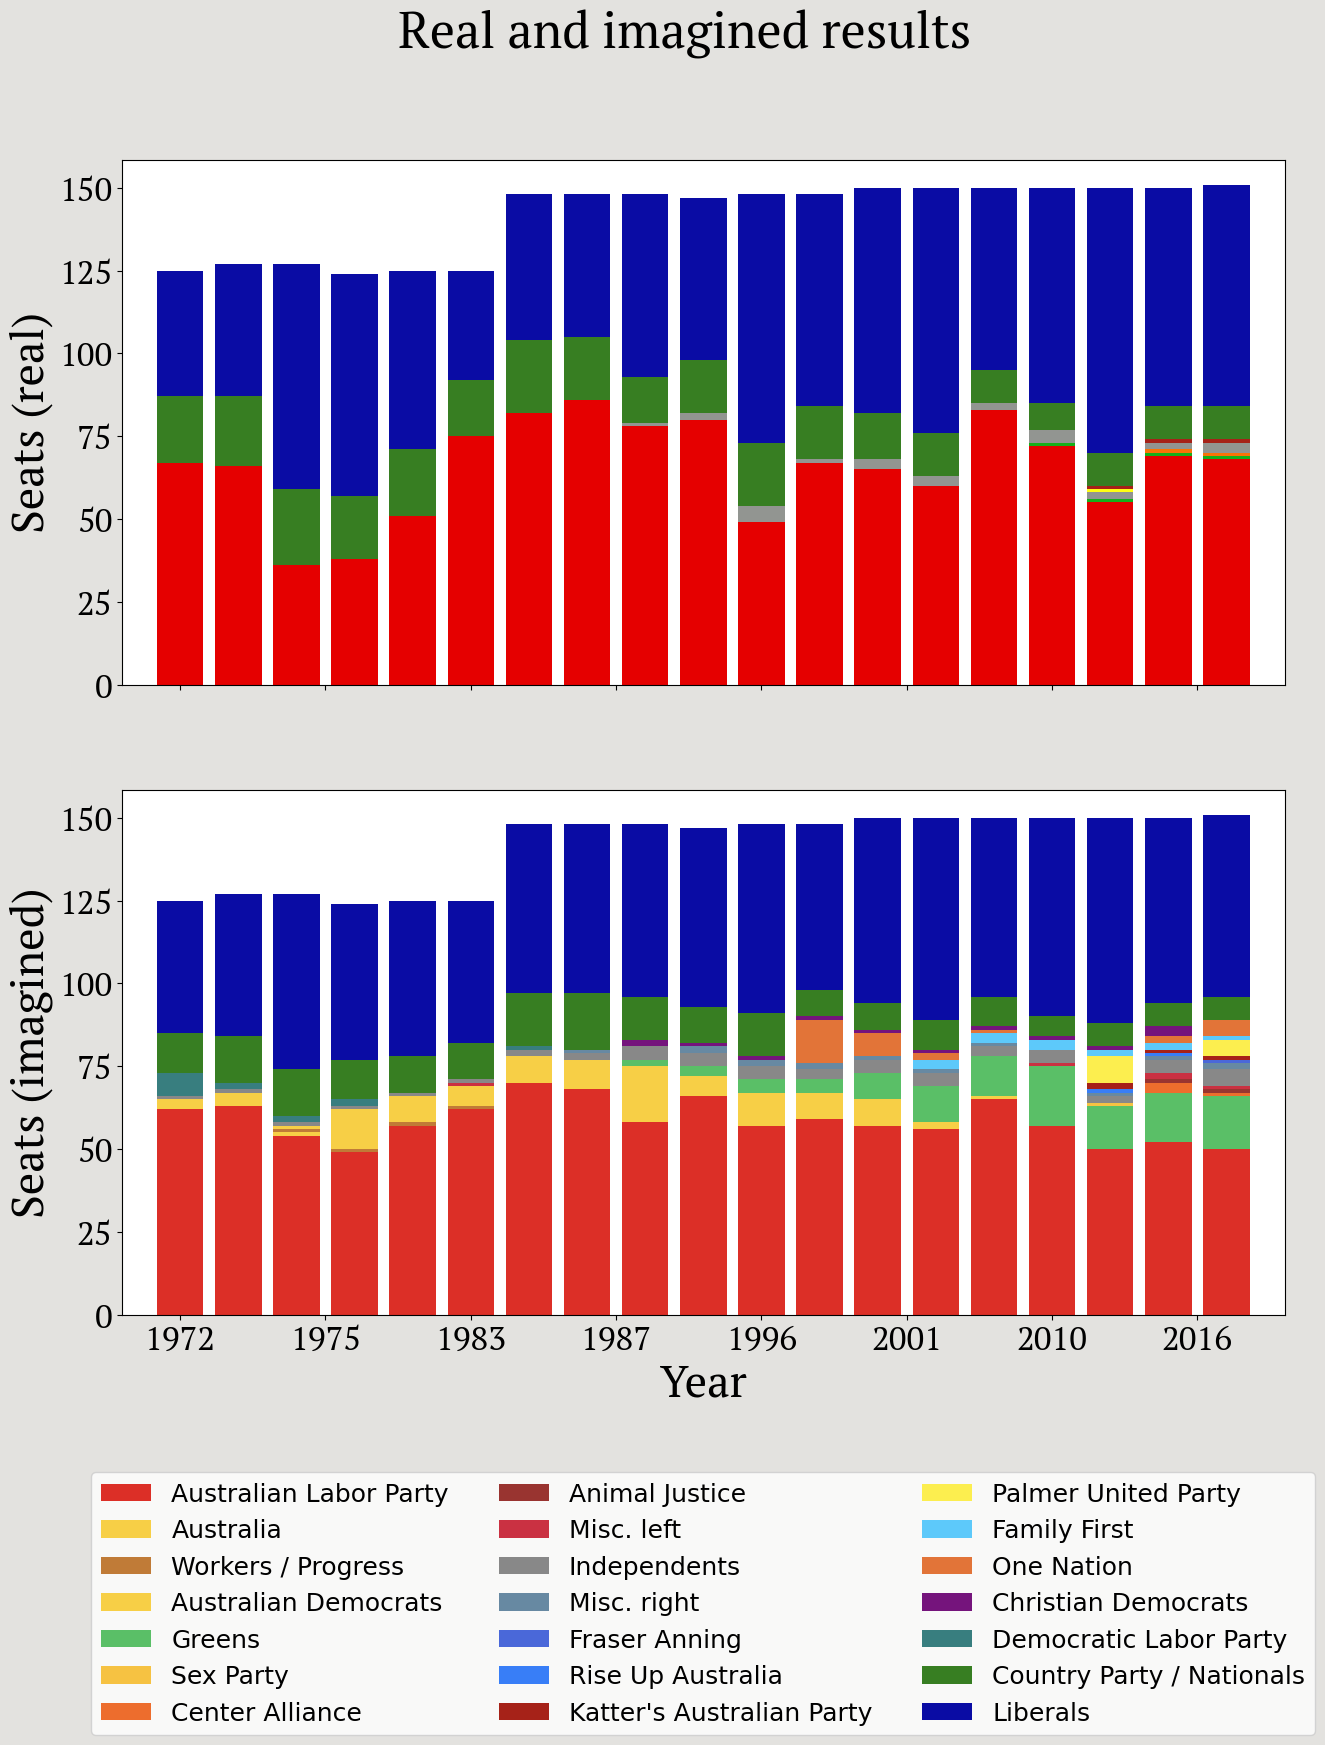
| Figure 3: Real and imagined results by year. The ability of PR to force interesting coalitions is evident. |
1996
Reality: Solid Coalition victory (94-59 + 5 INDs), PM Howard.
Under PR: Narrow right-wing bloc majority (75-73), PM Howard.
Senate: Tied.
John Howard had just come back from the precipice, regaining the Liberal leadership despite reckoning just a few years earlier that the odds of it happening were like “Lazarus with a triple bypass”. Election Night 1996 in our alternative reality was tense, unlike the landslide, clear-on-the-night result in reality: the left-wing bloc had 72 seats (Labor 57, Democrats 10, Greens 4 and the Natural Law 1), and the right-wing bloc had 72 as well (Liberals 57, Country Party 13, Christian Democrats 1, Against Further Immigration 1).
In reality, the 13 years from the loss to Hawke in 1983 to the solid win by Howard in 1996 are referred to as “years in the wilderness” by Liberal party faithful. In our alternative universe, where Malcolm Fraser’s 1975 trouncing of Whitlam was the only time a right-wing coalition had won an election in Australia since Harold Holt in 19663, it had been 19 years in the wilderness.
In the 148-seat parliament in our alternative universe, the kingmakers who ended the journey through the wilderness and handed John Howard the Prime Ministership were the four independents elected (in reality there were five): Pauline Hanson, Paul Filing, Graeme Campbell and Peter Andren (Allan Rocher, the fifth independent in the real 38th Parliament, had the fewest first preference votes so doesn’t get a quota). Three of these independents could reliably be called upon to vote with the right-wing bloc (Hanson, Filing, Campbell), bringing them to their majority of 75. Independent Peter Andren remained a wild card, not officially siding with either bloc, and ensuring the Howard government remained a by-election from no confidence throughout its entire first term.
1998
Reality: Coalition victory (80-67 + 1 IND), PM Howard.
Under PR: Narrow right-wing bloc majority (75-73), PM Howard.
Senate: Labor + Democrats + Greens majority.
In our PR version of 1998, it was John Howard’s turn to form an unsavoury coalition - under PR we would have had Deputy Prime Minister Pauline Hanson, who had entered parliament in 1996 as an independent to give her notorious maiden speech that introduced an anti-multicultural politics that has stuck to Australia’s shoe ever since.
Hanson’s One Nation party won 936,621 first preference votes, or 8.43%, and that support was significantly higher in Queensland. In reality however, she lost her seat in the House and One Nation turned their attention to the Senate.
Notwithstanding the ability of PR to give a boost to the impact of ephemeral movements like One Nation, their 13 seats and the Liberal/National Coalition’s 58 are still four votes short of a majority. They need the support of the Christian Democrats and their one seat (presumably occupied by founder Fred Nile) and the Australia First party’s one4, as well as at least two of the three independents that win representation at this election in our PR universe.
It’s hard to imagine who the independents would be: only Peter Andren, our wildcard from 1996, actually won a seat in this election, but given the characters of independent candidates in the 90s, usually disgruntled Liberal party members breaking off and running independently, I think it’s more likely that Howard gets a wafer-thin majority by doing deals with two of the four independents than all four signing up with Kim Beazley.
So for the first six years of his Prime Ministership, in our PR universe, John Howard had a two-seat majority in the House of Representatives and a difficult Senate.
2001
Reality: Coalition victory (82-65 + 3 INDs), PM Howard.
Under PR: Narrow left-wing bloc majority (76-74), PM Beazley.
Senate: Coalition + Independents majority.
Here’s another election that would have turned out very different under PR than reality: in 2001, only six weeks after 9/11, we would have seen Prime Minister Kim Beazley - or at least that’s how I see the electoral combinatorics playing out in this very close proportional result.
Beazley’s coalition: his 57 seats and the Greens and Democrats with 8 each give 73, so he needs three of the four independents to vote with him to give a majority, or all four to go to Howard for the reverse result. This would have been the most tense of post-election coalition negotiations, similar to what happened in 2013. So again we have to dive deeper and find out who these independents are. In reality in 2001 three independents were elected: Peter Andren, Tony Windsor and Bob Katter. Andren and Windsor would have leaned Beazley, I think, so it would have come down to Katter and the other imagined fourth independent we need to elect to compensate. Peter Andren’s support in Calare was substantial, his two-party preferred vote over 70%, so I think it wouldn’t be unreasonable to elect another independent aligned with him, giving Beazley his coalition.
2004
Reality: Solid Coalition victory (87-60 + 3 INDs), PM Howard.
Under PR: Narrow right-wing bloc majority (77-73), PM Howard.
Senate: Coalition majority.
In 2004 John Howard’s victory and popularity were significant enough that he controlled both houses of government in his own right, a rare feat in Australian politics, and this allowed him to pass some of the most brazen legislation of his eleven-year tenure, including the infamous WorkChoices.
In our alternative universe Howard’s lower house coalition is a little less pleasant: his 77-seat majority consists of the Liberals’ 61 and the Nationals’ 9, 2 for One Nation and 3 for Family First, a conservative Christian “family values” party formed in 2002, who won more than 235,000 first preference votes at this election, and one each for the Christian Democrats and the Citizen’s Electoral Council, a weird fringe party associated with the global LaRouche movement.
2004 marks the real beginning of the fragmented Australian right that the current preferential system manages to sticky-tape back together. In this election, six parties make up the right-wing bloc, compared to three in the left-wing bloc.
2007
Reality: Solid Labor victory (83-65 + 3 INDs), PM Rudd.
Under PR: Narrow left-wing bloc majority (78-72), PM Rudd.
Senate: Tied.
It was Kevin Rudd and his extremely successful “Kevin 07” campaign, combined with significant backlash against what many saw as overreach on Howard’s part after his surprise Senate win in 2004 and confusion around if and when Treasurer Peter Costello would serve as his successor, who finally unseated Howard after 11 years. In our alternative universe Rudd gets his victory as well, although with a slightly smaller majority.
In 2007 under PR, Bob Brown, leader of the Australian Greens would have been Deputy Prime Minister, with Rudd relying on Brown’s 12 seats to augment his 65; the additional 1 seat bringing the left-wing bloc to 78 goes to the Australian Democrats: 2007 is the last time they are represented in our PR alternative parliament after their first win in 1974.
2010
Reality: Narrow left-wing bloc majority (76-74), PM Gillard.
Under PR: Narrow left-wing bloc majority (78-72), PM Gillard.
Senate: Labor + Greens majority.
2010 was a very strange election in reality, giving a result that indeed required the kind of post-election negotiation stage reminiscent of our PR universe. Indeed the PR result is very similar to the real result, but Gillard has two more seats in her coalition, meaning independent Rob Oakeshott is no longer the “tipping point” vote.
Labor under Gillard have 57 seats, down 8 from their haul under Rudd in 2007, but presumably are spinning the story that under Rudd the loss would have been even more significant. The Greens picked up six of those, giving them 18 seats, the largest “third party” haul among all the fifty years of elections. So Bob Brown continues in his role as Deputy PM and presumably picks up another ministry or two. But Labor and the Greens together only have 75, so they do require at least one of the four independents. Based on how things went down in reality in 2010, this wouldn’t be a problem, and I think they would have ended up with 3 of the 4, with Katter siding with the opposition.
2013
Reality: Solid Coalition victory (90-55 + 3 INDs, 1 GRN, 1 PUP), PM Abbott.
Under PR: Solid right-wing bloc majority (82-68), PM Abbott.
Senate: Large crossbench (18 Senators).
2013 saw Tony Abbott, opposition leader for over five years, boot out an unpopular Labor government. Within a little over two years, Abbott would be deposed himself as leader due to poor polling (brought on, it must be said, by a series of poor decisions).
The backlash against Labor was real: they lose ten seats in our PR universe, a sizeable swing, and are in opposition against a solid right-wing bloc led by Abbott and his Liberal party’s 57 seats, with Deputy Prime Minister Clive Palmer’s eight and the National party’s seven. Yes, in 2013 Palmer’s PUP party, essentially just an advertising campaign, won 709,000 first preference votes nationwide, compared to the Nationals’ 596,000.
2016
Reality: Narrow Coalition victory (76-69 + 3 INDs, 1 GRN, 1 NXT), PM Turnbull.
Under PR: Narrow left-wing bloc majority (76-74), PM Shorten.
Senate: Large crossbench (20 Senators).
Malcolm Turnbull won a nailbiter against Bill Shorten in 2016, and in our PR universe, he loses in one, putting an end to his life-long ambition to be Prime Minister.
Shorten’s coalition would have taken some time to put together: Labor’s 52 and the Greens’ 15 gives 67, so still another nine seats are needed. Shorten could probably rely on the support of Nick Xenophon’s three votes, and one each for the Animal Justice party, the Liberal Democrats and a mish-mash of single-issue left-wing parties that get lumped into one seat. So that gives him 73, meaning he needs to rely on three of the four independents, three of whom already supported Gillard in 2010.
It’s only fair to consider Turnbull’s chances of forming a coalition as well. For the right-wing bloc to get to 73 seats, from which point it could court three of the four independents, would require the following motley crew of eight parties:
- Liberals (56)
- Nationals (7)
- Christian Democrats (3)5
- One Nation (2)
- Family First (2)
- Katter’s Australian Party (1)
- Rise Up Australia (1)
- A single seat representing a bunch of small (mostly far-) right-wing parties
This coalition would have been very unsavoury to Turnbull, and extremely unsavoury to independents Andrew Wilkie and Cathy McGowan, to the point that I think this coalition is far less likely than Shorten’s.
2019
Reality: Narrow Coalition victory (77-68 + 4INDs, 1 GRN, 1 NXT), PM Morrison.
Under PR: Narrow right-ring bloc majority (77-73), PM Morrison.
Senate: Slim right-wing bloc majority.
In 2019 however, in our PR universe, Scott Morrison has better luck forming a right-wing government made up of a large number of minor parties from the far right, representing the dramatic rise of ethnonationalist popularism worldwide in the end of the 2010s.
In reality, Morrison’s big-C Coalition won a slim victory in his own right. Under PR, Morrison’s coalition would have been comprised of eight parties: his Liberals (55), the Nationals (7), a resurgent One Nation (5) and a resurgent Clive Palmer (5), Family First (1), Katter’s Australian Party (1) and Fraser Anning’s Conservative National Party (1), as well as two seats that I’ve had to designate “Miscellaneous Right” due to the sheer number of small far-right parties that contested the 2019 election. This bloc, containing no small number of very prominent national personalities (Barnaby Joyce, Pauline Hanson, Clive Palmer, Bob Katter, Fraser Anning), would have been difficult to navigate, but I reckon Morrison would have managed it. If not, one or two of the five independents could have been recruited to replace the most unsavoury of the extremists, or as Scotty from Marketing may have rebranded it, the “new broad church”.
Conclusions
I really enjoyed looking back at Australian elections, some of which I’d experienced first-hand, others heard about like legends from my parents, and imagining a slightly different outcome. It’s clear that PR would have changed the Australian political landscape drastically, if everything else stayed the same of course: from an almost even split with 10/19 victories for the Coalition and 9/19 for Labor, under PR we saw 13/19 for Labor and only 6/19 for the Coalition.
Would PR necessarily mean a shift leftward? Is there something structurally wrong with the current system that biases it towards the right (like the American Electoral College) that PR is balancing out? I personally think it’s a quirk of how much variance there is among population of Australian electorates and the resulting power bias to rural electorates, which tend to lean right. PR removes this advantage and means that the vote each of the 144,391 electors from Canberra, Australia’s most populous electorate is equal to the vote of each of the 65,752 electors from Lingiari.
Footnotes
-
After running all the analysis I started to think it might be interesting to think about the results under PR systems with different electoral threshholds. I didn’t end up running the numbers, but it looks to me like there is a spectrum from full PR to the current system which can be thought of as a one-parameter space parametrised by the “electoral threshhold”. So the preferential voting essentially looks like what PR would look like with a threshhold around 30%, but with an extra “layer” afforded by the preferences, to attempt to fairly handle all those thrown-away votes. ↩
-
In reality, Hayden went on to serve as Governor-General of Australia 1989 to 1996. ↩
-
I didn’t fully calculate the PR results for elections prior to 1972, but in 1969 PR would have erased John Gorton’s slim victory and given the Prime Ministership to opposition leader Gough Whitlam. In 1966 Holt would still have won, and Menzies’ victories from 1949 to 1963 look robust enough to assume he’d keep his “longest serving Prime Minister” medal (1954 and 1961 would have been close). ↩
-
In the late 90s the Australia First party, led by Liberal breakaway Graeme Campbell, wasn’t quite as despicable as it is today. ↩
-
In 2016 the Christian Democrats had their best ever result with over 178,000 first preference votes, as a protest vote against Turnbull’s promise to hold the same-sex marriage plebescite, which eventually did occur and succeed in 2017. ↩