
For a while I’ve been keen to learn how to use the Twitter API to scrape tweets. In this post I’ll do some basic sentiment analysis on tweets I scraped during the Monday 20/4 airing of QandA, an Australian current affairs panel show which has become infamous in Australia for its lively Twitter feed.
The panel for this program consists of five people, together with the host Tony Jones. The panel this episode consisted of
- Derryn Hinch, a journalist and former radio personality who is famous for his outspoken views on child molestation rings (he has often defied court orders against naming child abusers)
- Andrew Robb, a member of the current conservative government who is the minister for trade and investment
- Anna Burke, a member of the centre-left opposition who used to be the house speaker
- Dave Hughes, a popular comedian
- Jane Burns, CEO of a research group that studies how technology affects the lives of young people
As the program is political in nature, the ABC usually provides a breakdown of the political identifications of their audience, and attempts to make this breakdown as similar as possible to the true voting intentions of the Australian public.
Sentiment analysis using out-of-the-box tools
I wanted to try and assess the political leanings of the Twitter users using the hashtag #QandA during the episode’s broadcast. This required a number of steps.
1. Scraping Twitter for tweet data
Twitter has a very usable API and there’s a great Python package called tweepy that allows you to automate everything using a Python script. I fiddled around with the default tweepy script to scrape the Twitter stream live for a certain search term, using the term QandA, and to write the output to a text file. The free API is limited to only providing 1% of the Firehose (Twitter’s in house term for the live feed of all tweets), but since Q&A only get around 20 000 tweets per episode, there’s no way this data is going to exceed 1% of the 6000 tweets per second in the Firehose. So I set the script to run from 9.20PM to 11:00PM AEST on Monday April 20 and saved only the body text of all tweets using the hashtag (one interesting thing I learned is what a big-name hashtag looks like after the mainstream traffic has disappeared. When the show isn’t broadcasting, #QandA is a whole bunch of hideous homophobic propaganda).
2. Devising sentiment analysis
The very basic first-pass analysis I want to do is a little different to the usual textbook Twitter sentiment analysis problem of classifying a tweet as happy or sad. Classifying a tweet as right or left is quite hard, so rather than that I want to to do the following process:
- identify if a tweet contains a single pertinent political keyword (‘Tony Abbott’, ‘Coalition’, ‘ALP’, etc. etc.) which has a particular alignment on the political spectrum
- assess the sentiment of the other words in the tweet
- come up with a corresponding political ranking (right or left will do; it’s hard to quantify beyond that)
For example, the tweet
I don't understand how the Coalition can be so cruel towards asylum seekers #QandA
would be rated as left-wing, since it contains the keyword Coalition and the negative-sentiment marker cruel.
This is a pretty crude model, but let’s use it for a first attempt. So of all the tweets scraped during the broadcast, I only want to look at
- those containing a mention of a left- or right-wing entity
- those which have terms in my sentiments dictionary (obtained online and built on Twitter data, but not specifically Australian or political, so it won’t be perfect).
The code looks like this:
import pandas as pd
from pandas import DataFrame
import math
import csv
import numpy as np

frame = pd.read_csv('twitter_sentiment_list.csv',skiprows=0,delim_whitespace=False,header=0,names=['term','pos','neg'])
frame.index = frame['term']

with open('left_list.txt', 'rb') as f:
    reader = csv.reader(f)
    left_list = list(reader)[0]

with open('right_list.txt', 'rb') as f:
    reader = csv.reader(f)
    right_list = list(reader)[0]

with open('tweetdump.txt') as f:
    tweets = f.readlines()

tweet_total = 0
tweets_analysed = 0
left_tweets = 0
right_tweets = 0

for tweet in tweets:

    tweet_total += 1

    tweet_words = tweet.split(' ')

    right_count = 0
    left_count = 0

    keywords = []

    for right_term in right_list:
        if right_term in tweet_words:
            keywords.append(right_term)
            right_count += 1
    for left_term in left_list:
        if left_term in tweet_words:
            keywords.append(left_term)
            left_count += 1

    if (left_count >= 1 and right_count == 0) or (left_count == 0 and right_count >= 1):

        tweets_analysed +=1

        pos_sentiment = 0
        neg_sentiment = 0

        for word in tweet_words:
            if word in frame['term'].values:
                pos_sentiment = pos_sentiment + frame['pos']['term']
                neg_sentiment = neg_sentiment + frame['neg']['term']
        prob_happy = np.reciprocal(np.exp(neg_sentiment - pos_sentiment)+1)
        prob_sad = 1-prob_happy
        if left_count >= 1:
            print tweet, '| mentions left entity with keywords ' + ''.join(keywords) + ', '+str(np.round(prob_happy,3)) +'% of being positive'
            if prob_happy > 0.5:
                left_tweets +=1
            elif prob_happy <0.5:
                right_tweets +=1
        else:
            print tweet, '| mentions right entity with keywords ' +''.join(keywords) + ', ' +str(np.round(prob_happy,3)) +'% of being positive'
            if prob_happy >0.5:
                right_tweets +=1
            elif prob_happy <0.5:
                left_tweets +=1


print 'Total tweets: ' + str(tweet_total)
print 'Tweets analysed: ' + str(tweets_analysed) + ' (' +str(np.round(100*float(tweets_analysed)/float(tweet_total),1))+'%)'
print 'Left tweets: ' +str(left_tweets) + ' (' +str(np.round(100*float(left_tweets)/float(tweets_analysed),1))+'%)'
print 'Right tweets: ' +str(right_tweets) + ' (' +str(np.round(100*float(right_tweets)/float(tweets_analysed),1))+'%)'
And here’s the results:
Total tweets: 21952
Tweets analysed: 2945 (13.4%)
Left tweets: 463 (15.7%)
Right tweets: 1793 (60.9%)
[Finished in 14.7s]
3. Analysis of output
Some analysis of this then. Firstly, we’re only looking at 13.4% of the tweets with this basic model. And of these tweets, it’s classifying only 16% of them as being from left-wing users (which doesn’t seem quite right to me).
@qanda Robb ' meds are obviously working well.  He is now as a LNP minister unwilling to support the most vulnerable and at risk
| mentions right entity with keywords Robb, 0.815% of being positive
| sentiment derived from words medsobviouslynow
Love how #QandA only let Anna Burke respond directly to #eastwestlink
| mentions left entity with keywords BurkeAnna, 0.729% of being positive
| sentiment derived from words letrespond
Abbott called the Vic state election a referendum on east west link- and Daniel Won #qanda
| mentions right entity with keywords Abbott, 0.729% of being positive
| sentiment derived from words eastwest
Bloody Greens and their bloody communist public transport! Where will it end? #qanda
| mentions left entity with keywords Greens, 0.729% of being positive
| sentiment derived from words bloodypublic
Great topics on @QandA tonight! #Labour MP Anna Burke is especially #entertaining
| mentions left entity with keywords BurkeAnna, 0.729% of being positive
| sentiment derived from words topicsespecially
#qanda Robb suggests that his Govt needs to be the one to calm the fear brought about by terrorism & radicalisation LOL @QandA
| mentions right entity with keywords Robb, 0.815% of being positive
| sentiment derived from words needscalmfear
This comes down really to the difficulties of performing sentiment analysis on tweets. Seeing as tweets are only 140 characters, it’s very difficult to get a proper picture of the sentiment. Of the six tweets I posted above:
- the model gets the first one exactly right. There’s not enough information there to classify the sentiment, and it rightly identifies the entity.
- the second one is a bit harder to classify because of its sarcastic tone but the model gets it right using the keywords
- the third tweet is misclassifed (it’s very hard for a model to get this right as it’s a sarcastic comment about regional politics in the state of Victoria) and the model is using irrelevant words to get the sentiment
- the fourth tweet is misclassified by sentiment as well
- the fifth tweet is classified exactly right
- the final tweet is again misclassified because the sentiment analysis isn’t accurate enough
4. Next step
Because the main issue is the accuracy of the sentiment analysis (the left-right entity recognition is basic but works well enough), I thought I’d fix this by developing my own sentiment dictionary. I want to hand-label as many tweets as I can as positive or negative (or irrelevant) and then use this data to build a sentiment dictionary for next week’s program’s tweets.
Training a custom sentiment dictionary
Up to the limits of my own patience, I hand-classified as many tweets from the April 20 broadcast of QandA as positive, negative (or spam), with the goal of using these to train a sentiment dictionary to use on the April 27 broadcast’s tweets. I also removed all retweets from the dataset (which I suppose I should have done in the previous post as well). There was a slight problem in the way I’d written the tweets to file and forgotten to remove the new-line characters within tweets, so my code was also reading all these irrelevant lines as separate tweets.
I came across a whole raft of issues as soon as I started this process. The main problem, as I stated in the previous post, is that a large proportion of tweets are too short to be able to be judged for their sentiment at all. A lot of them are irrelevant for my purposes of estimating the political leanings of Twitter users watching QandA because they represent conversations between users (e.g. “are you watching #QandA?”) rather than actual comment on the program and its contents and panel members.
I wrote a Python script to make the process of classifying the tweet data I had a little easier. Since the other portion of my code, the simple political entity classifier, should take care of whether the conversation is relevant or not, I can use all the tweets to train for sentiment data. Initially I hoped I would only need three classifications: positive, negative, or spam. There is obviously some subjectivity here, particularly with the short and often sarcastic nature of tweets, but hopefully the volume of data will take care of this. After looking at enough tweets I realised some tweets just cannot be classified as positive or negative and so we also need a neutral classification.
My training code is pretty simple, because all the real work is unfortunately with the human classifying the tweets:
import numpy as np

with open('tweetdump_new.txt') as f:
    tweets = f.readlines()
classified_dict = {}
for tweet in tweets:
    classified_dict[tweet] = False
tweets_total = len(classified_dict)

def main():

    ## Keep two files open: test_tweets.txt which contains the
    ## unclassified tweet data, and trained_tweets.txt which contains the
    ## classified tweet data.

    with open('trained_tweets.txt', 'a') as g:
        count = 0
        for tweet in tweets:
            print tweet
            classification = raw_input('Classify this tweet as negative (0), positive (1), neutral(2) or spam (9): ')
            g.write(tweet.replace(',','') + str(classification))
            g.write('\n')
            classified_dict[tweet] = True
            print '-----------------------------------------------'
            count = count + 1
            if count%40 == 0:
                print str(np.round(100*float(count)/float(tweets_total),2))+'% completed...'
                print '-----------------------------------------------'

if __name__ == '__main__':
    try:
        main()
    except KeyboardInterrupt:
        with open('test_tweets.txt', 'w') as f:
            for tweet in classified_dict:
                if classified_dict[tweet] == False:
                    f.write(tweet)
The code contains two small improvements on the most basic idea possible; a percentage completion counter for sanity purposes, which prints progress every forty tweets, and the ability to quit the program and pick up where you left off (it just writes all the unclassified tweets over the input file so you can start again with a smaller file).
One very difficult consideration is how to deal with sarcasm on the training set. Often words which you know should be assigned a positive sentiment score are being used sarcastically in a tweet that overall has a negative sentiment. I score these tweets as positive in the optimistic (and untested, and probably misguided) view that there is more genuine discussion on Twitter than sarcasm.
Some things I noticed doing this classification before I got bored and just used what I’d completed:
- a plurality of tweets are negative (the split between negative / positive / neutral is about 45/30/25).
- this process is bound to introduce a whole bunch of subjectivity.. hopefully my left-wing bias is not obvious
- classifying tweets is extremely difficult! Sometimes you can spend minutes agonizing over tweets deciding on their sentiment.
I classified 1000 tweets from the first broadcast, which gave me a corpus of over 3300 words with a sentiment score. It was then easy to get a crude sentiment score for each tweet from the second broadcast’s feed:
import pandas as pd
from pandas import DataFrame
import numpy as np
import matplotlib.pyplot as plt

frame = pd.read_csv('SentimentDict.txt',skiprows=0,delim_whitespace=False,header=0,names=['term','rating'])
frame.index = frame['term']

with open('tweetdump27_new.txt') as f:
    tweets = f.readlines()

def GetSentiment(tweet):
    score = 0
    for word in tweet.split(' '):
        try:
            score = score + frame['rating'][word]
        except KeyError:
            pass
    return score

scores_list = []
for tweet in tweets:
    if type(GetSentiment(tweet)) is np.int64:
        scores_list.append(float(GetSentiment(tweet))/float(len(tweet)))

plt.hist(scores_list,bins = 50)
plt.show()

[Finished in 28.7s]
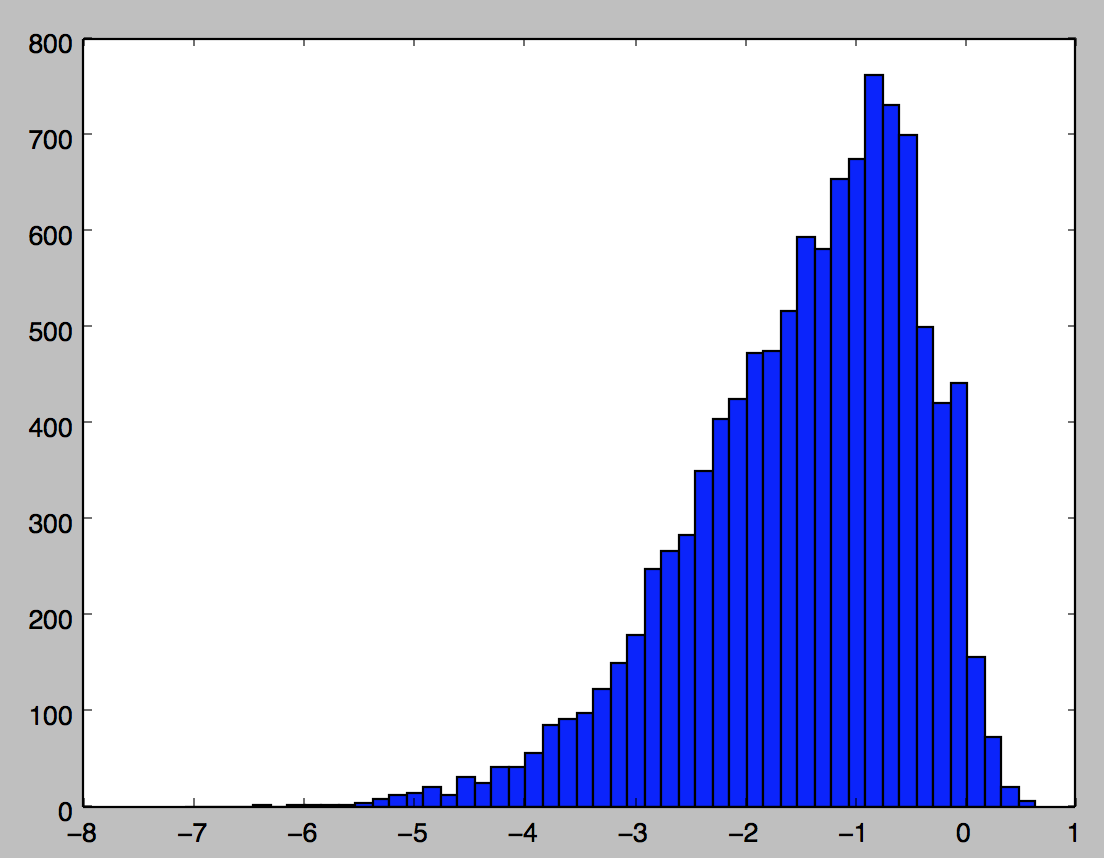
We can see the distribution of the (length-adjusted) sentiments very well in the above image (there’s 11 224 tweets being scored here, once I’ve taken out retweets and spam). Notice that less than 5% of tweets are actually assigned a positive score (since there’s so much negativity on Twitter, common words like “the” end up with highly negative scores by virtue of appearing in more negative tweets than positive).
Two things remain to do (noting that the analysis will only get better and more accurate the more tweets I classify):
- use the training data to come up with a decision boundary for tweets to be labelled as positive or negative
- add the basic left/right entity recognition into the analysis and try to answer my original question again
Estimating political affiliations
I now want to put all these pieces together to try and get a feel for the political leanings of Twitter users watching the program. The big problem with this analysis, as I mentioned above, is that most tweets are negative, so even the positive tweets are comprised of words with negative sentiment.
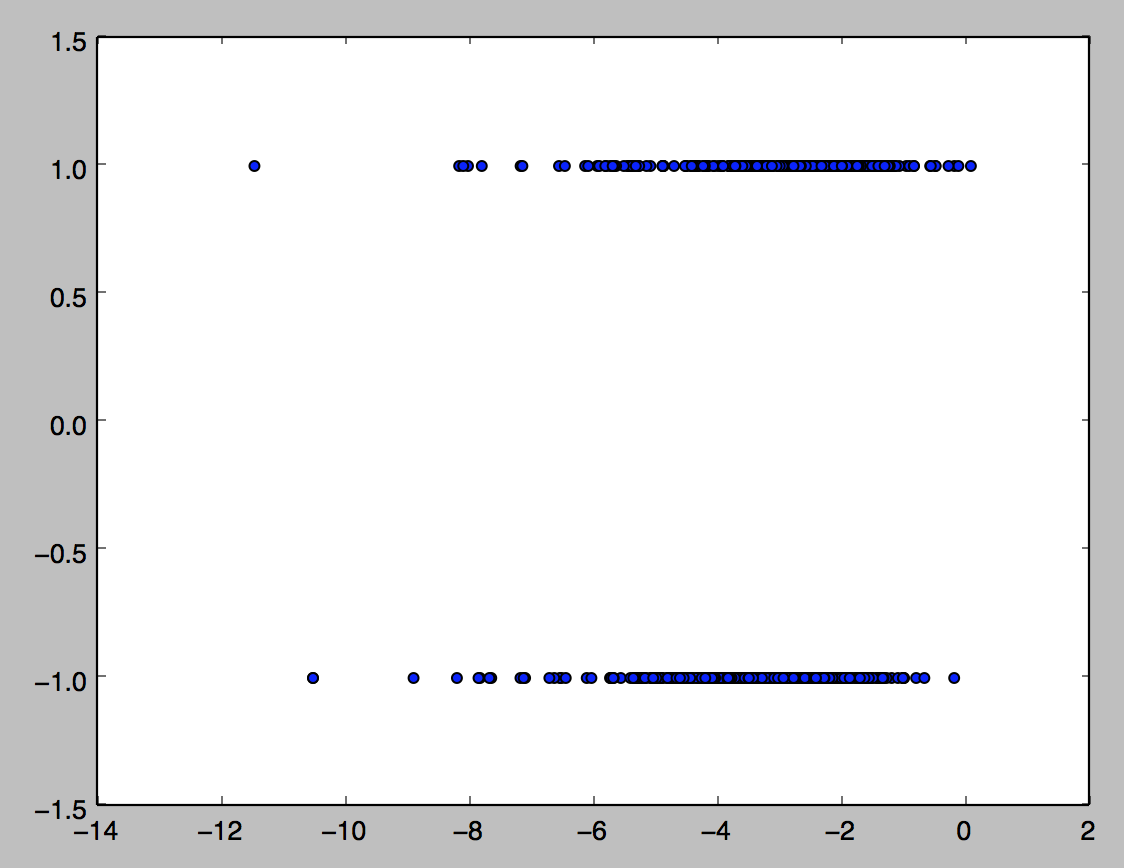
This diagram shows the real problem; of the 764 tweets I hand-classified as positive or negative, using the basic calculation from the previous post, it’s very difficult to separate them by their sentiment score alone. However, if we include two variables, namely
NormalisedSentiment: sum of all sentiments for words in the corpus in the tweet, divided by the total number of words in the tweet
def NormalisedSentiment(tweet):
    score = 0
    for word in tweet.split(' '):
        try:
            score = score + sentiment_dict['rating'][word]
        except KeyError:
            pass
    return score
NegativePercentage: number of words with a sentiment less than zero, divided by the total number of words in the tweet
def NegativePercentage(tweet):
    total_words = 0
    bad_words = 0
    for word in tweet.split(' '):
        try:
            if sentiment_dict['rating'][word] < 0:
                total_words += 1
                bad_words +=1
            else:
                total_words += 1
        except KeyError:
            pass
    return float(bad_words) / float(total_words)
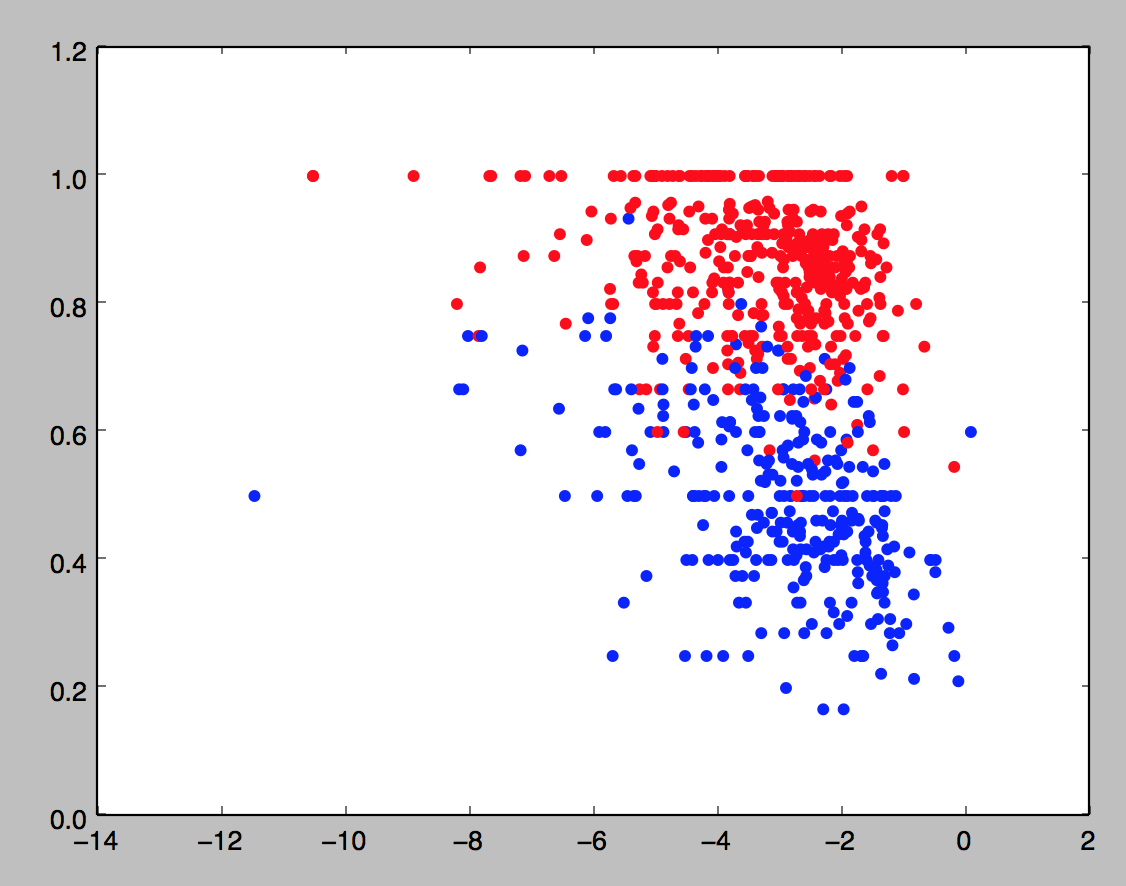
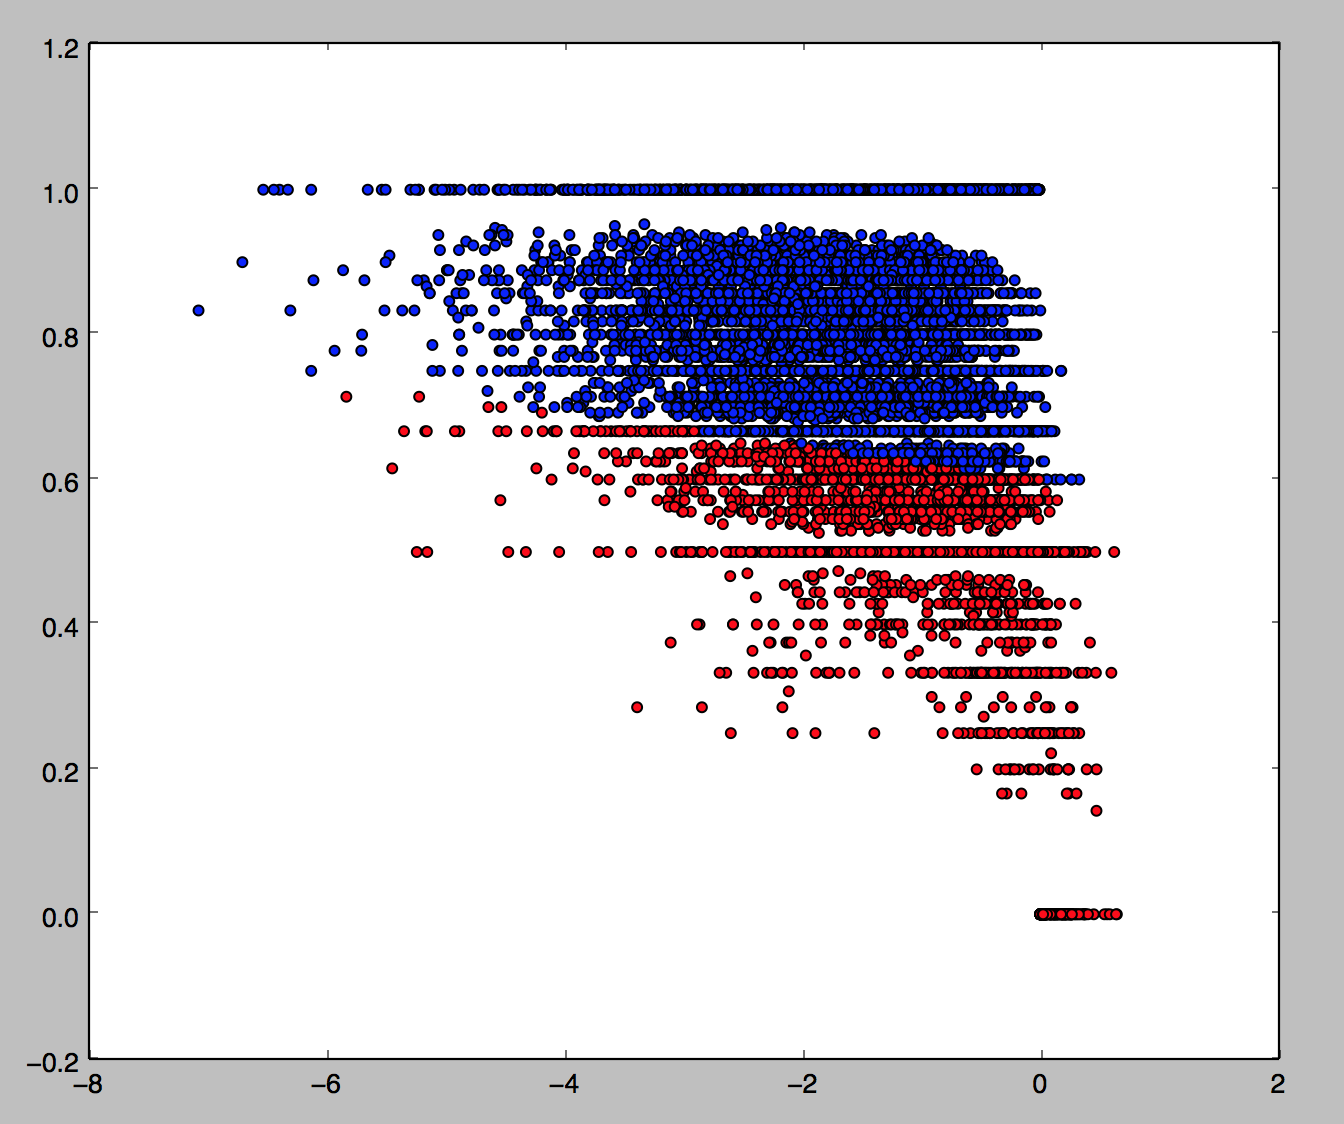
If we do a scatter plot of these two variables and color by classification (blue is positive, red is negative),
training_data = pd.DataFrame([tweets_final, normsent, negperc, classes]).transpose()
training_data.columns = ['tweet', 'normsent', 'negperc', 'class']

X = training_data[['normsent', 'negperc']].values
y = training_data['class']

color_map = []
for score in classes:
    if score == 1:
        color_map.append('b')
    else:
        color_map.append('r')
plt.scatter(training_data.normsent, training_data.negperc, c =color_map)
plt.show()
we get the following picture:
I now want to use simple support vector machines (which is just linear regression in this easy case) to train a decision boundary on this training data. Scikit-learn makes this particularly straightforward (I found a function plot_surface to plot the decision boundary as I had a bit of trouble figuring it out myself; I’m not quite sure why it comes out as a squiggle, but it gets the point across nevertheless):
est = svm.SVC(kernel = 'linear')
linear_model = est.fit(X,y)
ax = plt.gca()
ax.scatter(training_data.normsent, training_data.negperc, c =color_map)
plot_surface(est, X[:,0], X[:,1],ax =ax)
plt.show()
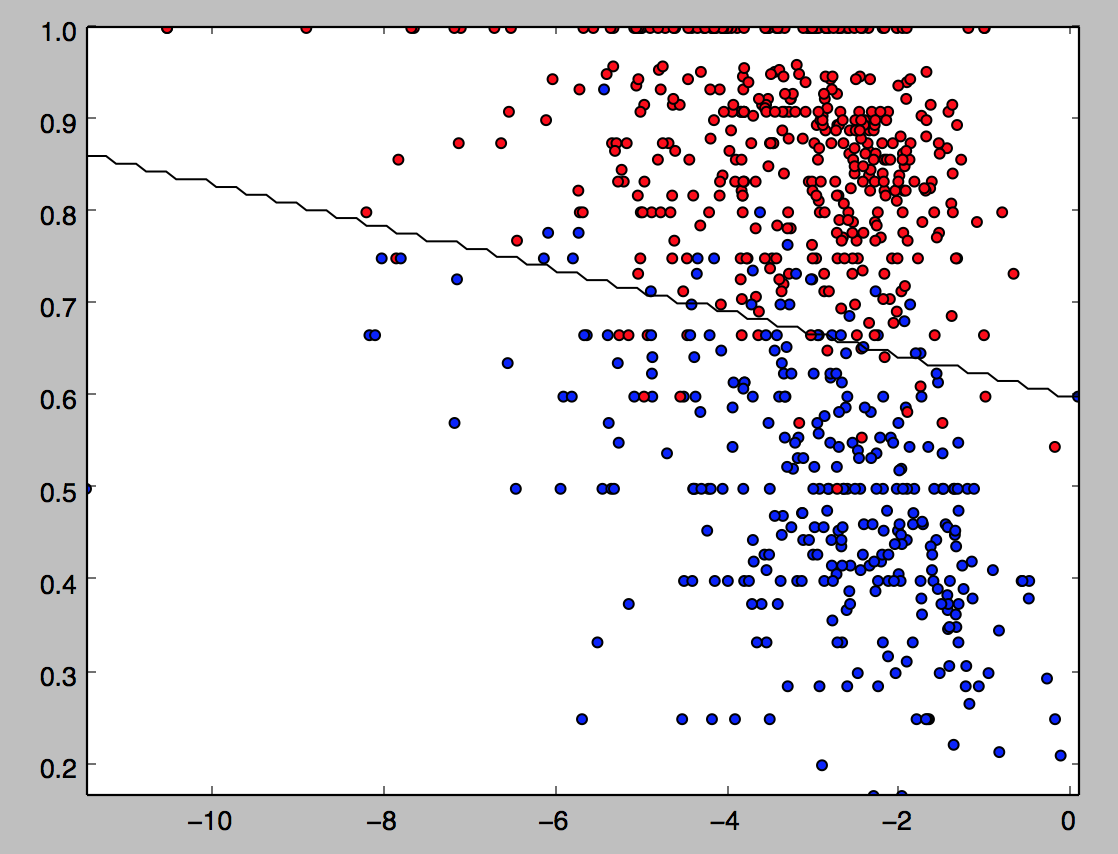
We then fit this model to the much larger training set (noting again the model, which currently has about 72% accuracy, will only get better the more tweets I classify):
Let’s see how this classification does with a few examples before we finish up by adding in the basic entity recognition:
My smelly fat butternut has decided to watch #qanda with me
    | negative
settling in for another entertaining #qanda
    | positive
Just saw the @QandA panel. Time to go to bed. Night.
    | positive
I can hear it now on #qanda #theirabc tonight.  Free speech hypocrites  #pmlive
    | negative
Thank you @tanya_plibersek for supporting a binding vote. Human rights are not optional. #ItsTimeToBind #qanda
    | negative
@QandA #QandA @tanya_plibersek for PM
    | positive
Dare I watch #qanda tonight after the disappointing censorship of TPP related questions last week?
    | negative
turning on the hate faucet for another week #qanda
    | negative
ah. finally can live tweet @QandA. wish I had something worthy to say.
    | positive
This model seems like it’s doing a fairly decent (but obviously imperfect) job of classifying these tweets.
So using a list of right-wing associated words like
Coalition,coalition,Liberal,liberal,libs,Libs,Abbott,abbott,abbot,Abbot,Abott,abott,Howard,howard,Robb,robb,Andrew,andrew,Menzies,menzies,pm,PM,prime minister,Prime Minister,Tony,tony,Arthur,arthur,Sinodinos,sinodinos,tim,Tim,fischer,Fischer
and a similar list for left-words, we can color the tweets again according to whether they are left-aligned (negative with a right entity or positive with a left entity) which are red, right-aligned (vice versa) which are blue, or neither, which are white.

Left tweets: 6.57%
Right tweets: 4.01%
Total tweets: 10766
[Finished in 49.1s]
This gives 62% of tweets where an entity can be identified as left-wing, and 38% as right-wing (and fits in very well with the ABC’s 39/39/22 ALP/COA/GRN split in the studio audience). This seems fairly believable to me (note however that only 11% of tweets have an entity identified, hence all the white in the picture). Note it doesn’t look like there’s much of a relationship between right-left and positive-negative.
I will remark finally that, although this model isn’t great, it can easily be improved through the “unreasonable effectiveness of data”: all this needs to get much better is more human classification of tweets, and a better input file for entity recognition.